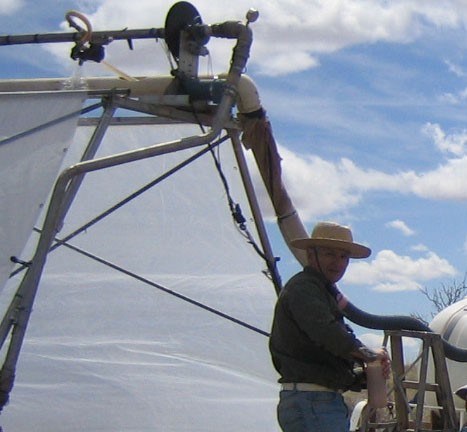
Working with rainfall simulators in the field. Collecting water and sediments for data analysis addressed to control pollution
Project : Carbon sequestration (based on surface only)
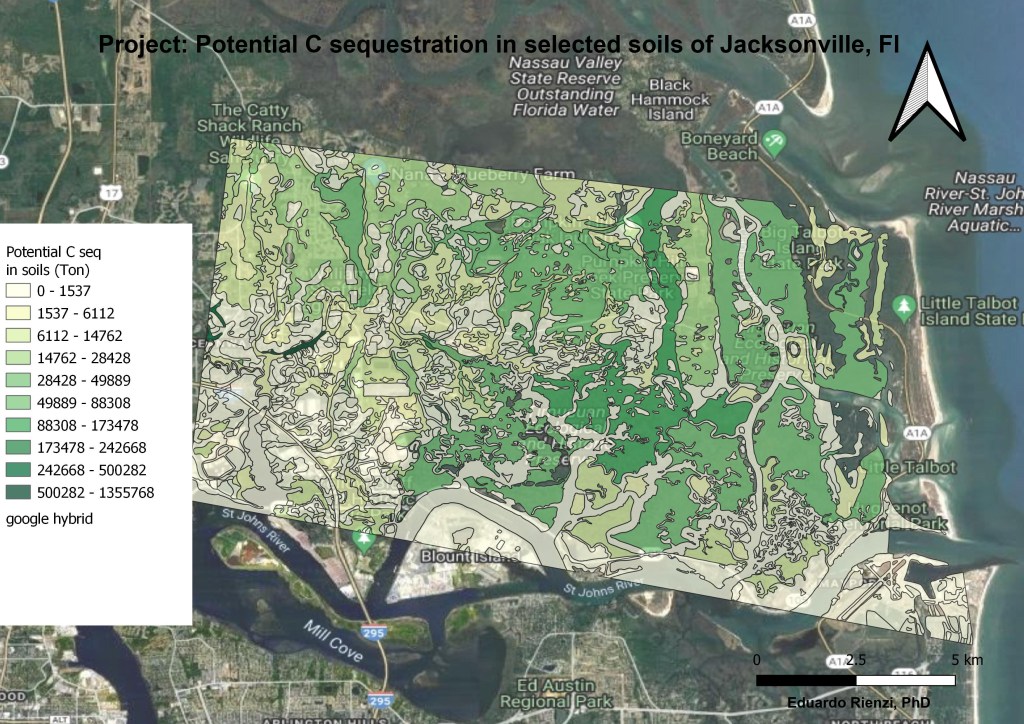
Technology: Several techniques were applied. Field samples in a specific sampling framework in order to apply geostatistics using also a soil map at level of series (Soil Taxonomy). Data were processed with R and represented with Qgis. DEM and other imageries provided for USGS Gateway (public domain)
Project Duration
6 Months
The objective of this assessment was to analyze the potential of Carbon sequestration in soils (ton /m2 ) in the selected area. Only data of soil organic carbon were used to illustrate their importance as C reservoir for the Voluntary Carbon Market (VCM). However, often this reservoir is ignored when a forest is certified for C sequestration. Notice that each C ton(e) represents 40 to 80U$S in VCM.
Project : Assessment of C sequestration in soils (based in soil volume)
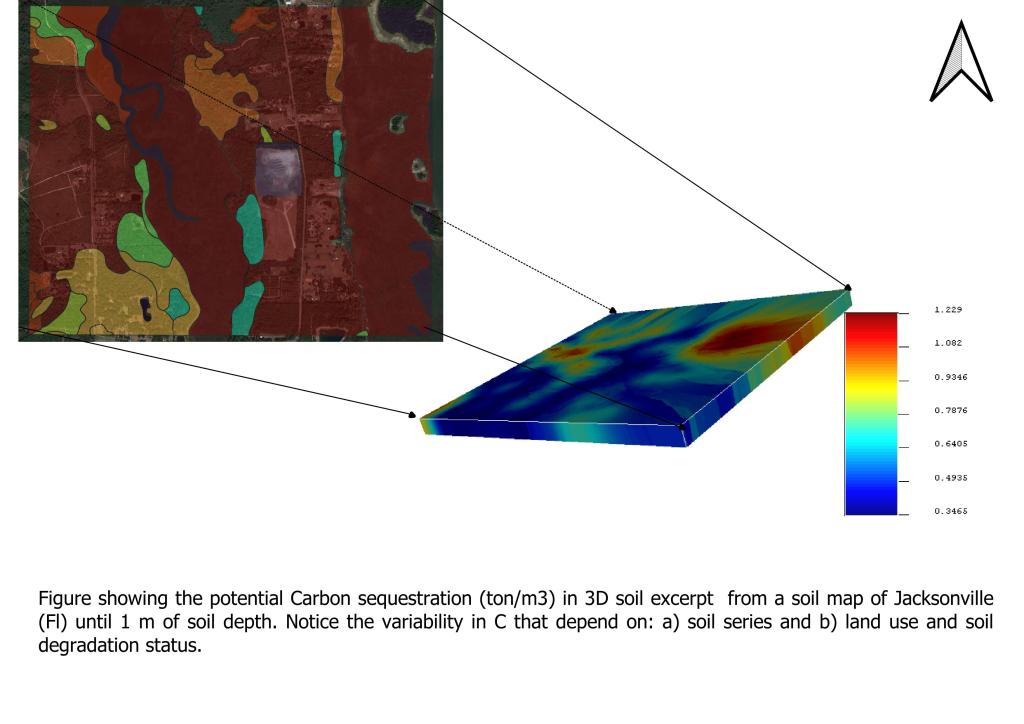
Technology: Based on previous soil map in the selected region of Jacksonville, Fl. The analysis involved horizon evaluation in 3D for each soil series found in the selected area. Data were processed with R and Python, using semivariograms and 3D Kriging
Project Duration
4 Months
In a landscape, often soils are considered “areas” when in reality, soils are 3D bodies, an anisotropic and complex open system. This excerpt based on the previous soil map is showing the importance of soils as a reliable carbon reservoir. When included in a framework of C assessment in a forested landscape, it would increase substantially the total amount of C ready to be offered in the Voluntary Carbon Market.
Project: Modeling organic carbon content in sediment from different tillage systems. State Space model approach
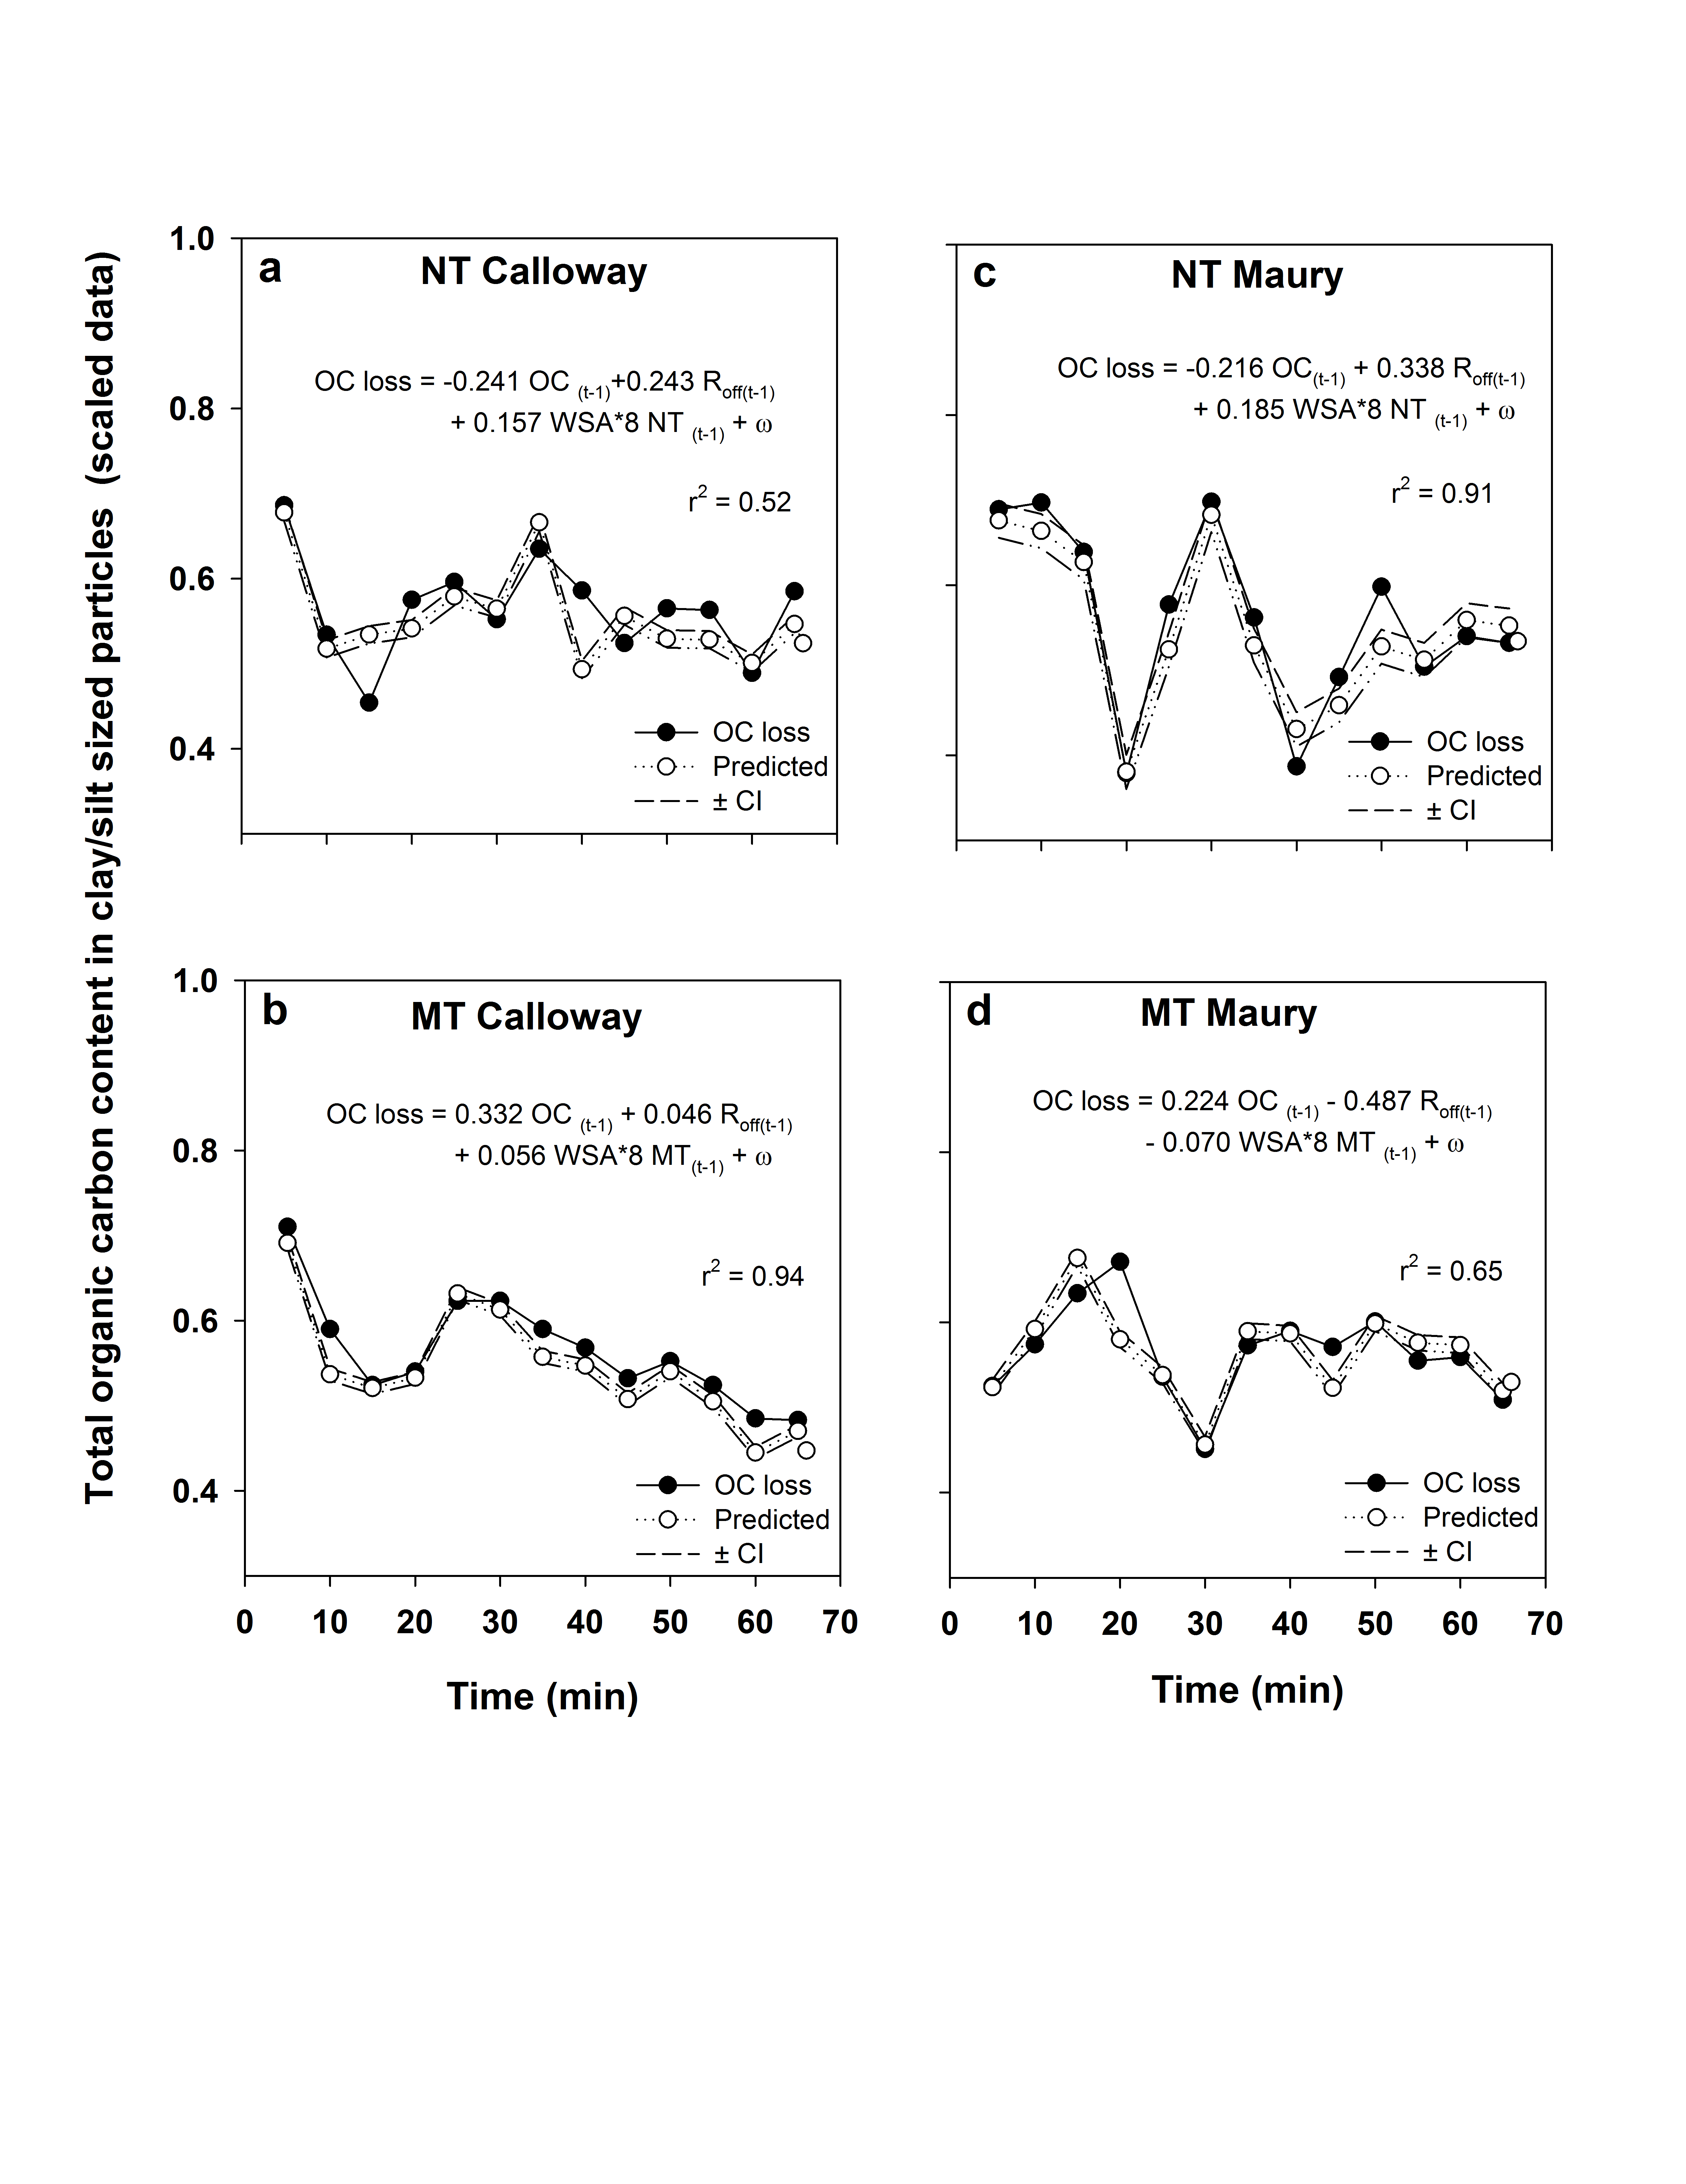
Technology: Using rainfall simulator in the field, 250 samples were used to create a state space model of OC content in particles smaller than 50 microns. For this example, only No tillage (NT), Conventional tillage (MT) and two soils were used. SAS and R statistical programs were used to build a state space model to describe the OC content evaluated in particles at the laboratory.
Project Duration
24 Months
Based on my publication in Catena (2017), the Figure illustrates the evolution of OC content in clay/silt size particles measured every 5 minutes from two different soils in Kentucky. The equation created with a State space model shows the variables used for the prediction.
Project: Evaluation of C losses in a forested watershed
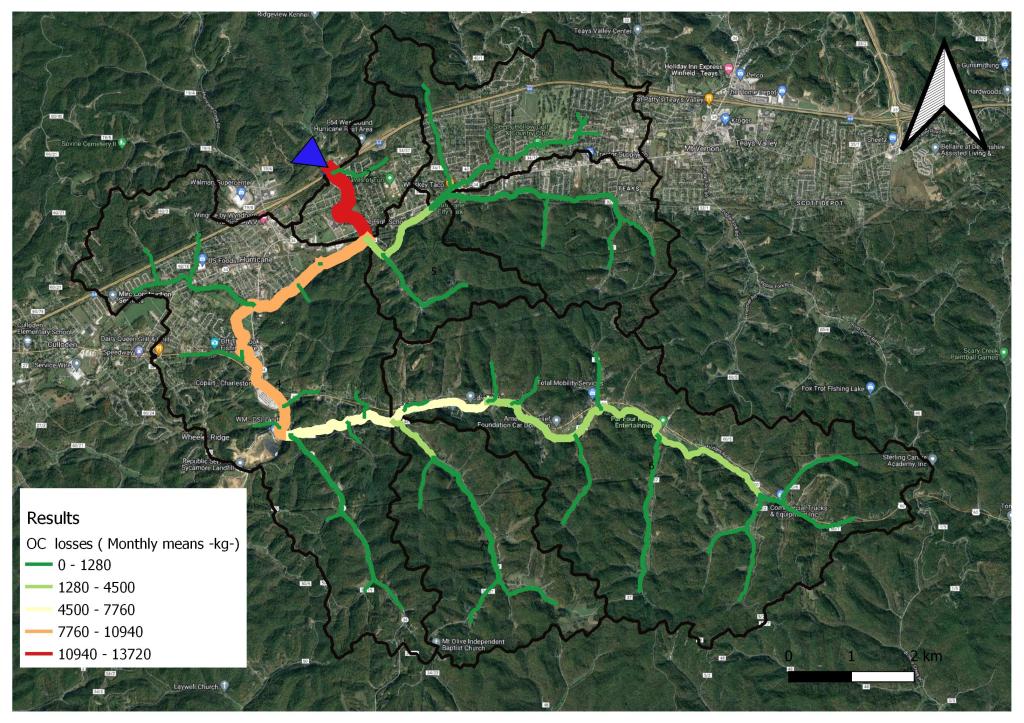
Technology: The watershed was delineated using SWAT and QGIS. Data for different sources: rainfall data from different airports and from databases were used. Time series analysis and autoregressive models (in R) were used to close gaps in rainfall data. Field samples in the river was taken with automatic samplers and added to historic series (USGS) DEM and imageries from USGS Gateway.
Project Duration
8 Months
The region corresponds to West Virginia, with a forest-dominated landscape. It is a fact that inside of a watershed, all of the resources are interconnected for water; the river is showing the system stability and its response through the years. The objective was to evaluate the C fate in a stable ecosystem as a baseline to compare with other watersheds more disturbed in the region. In addition, could be used to evaluate the mass balance for C sequestration.
Project: Detecting soil water content with Near Infrared Spectrometry
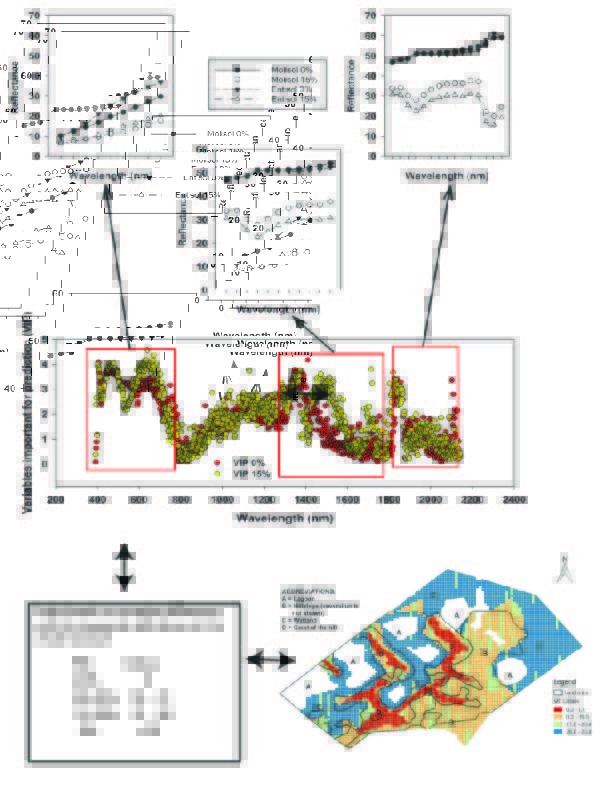
Technology: More than 1,500 soil samples from NAPT were analyzed in lab to create a database of reflectance (From UV to far-infrared). For this example, only NIR response was used. SAS statistical program was used to built a small set of variables important for prediction (VIP) from partial least square regression. Data from a farm was used to test the index with an experimental multispectral camera mounted in an UAV.
Project Duration
6 Months
Based on my book chapter “Use of spectral data from on-the-go multispectral cameras for monitoring soil surface moisture: The partial least square regression for data mining, analysis and prediction.” In: “INNOVATIONS IN AGRC. & BIOLOGICAL ENGINEERING”, published by Apple Academic Press, Inc (2017) ISBN: 9781771885928.
The Figure illustrates the procedure used to create a simple index based on precise laboratory-created database, and data from a sandy loam soil field (approx. 254 acres) . The Index was based on a limit of 25% of soil water content (light blue color in the map, where red color represents almost dry soils) and the average reflectance established for each one of the VIP selected regions.
Project: pollution in a watershed
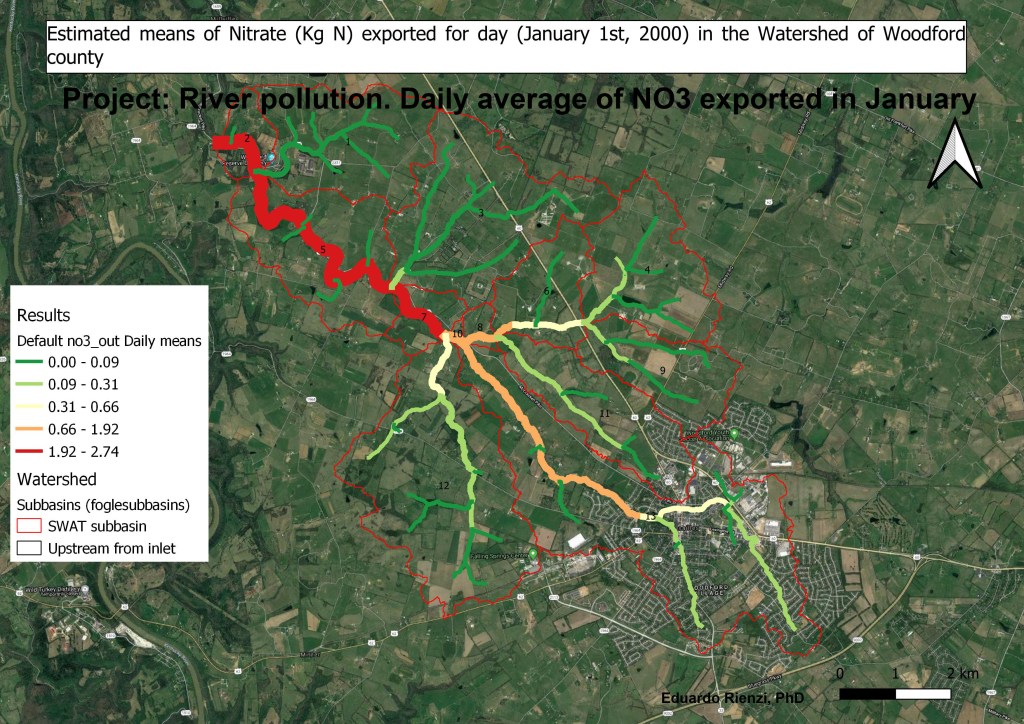
Tecnology: data sampler in the river and series recorded for the University. Chain of custody in accordance with EPA, data analyzed and modeled with QGIS and SWAT
Project Duration
9 Months
In accordance to the expected, crop areas determined a continuous release of Nitrate in the watershed. The analysis provide support to prioritize where different BMPs must be located for producing the best impact to control pollution at watershed level.
Project: Evaluation of potential abatement of water table in an irrigation farm

Technology: data measured in the field and provided by the farmer.
Modflow with ModelMuse were used for modeling, and predicting the potential groundwater abatement in the next 10 years. Displayed with QGIS.
Project Duration:
3 Months
The results indicate an important abatement (in meters) in the water table if the activities continues with the actual level of consumption. Often ignored, the groundwater recharge level is an important variable to evaluate when using water for irrigation purposes. It seems very extended the wrong concept of “inexhaustible natural resources”
Project: Assessment of impedance (soil compaction) to increase crop yield in No tillage farm

Technology: field sampling with a cone penetrometer (MPa) each 5 cm until 70 cm of soil depth; data analyzed using spatial statistics; semivariograms and interpolation with kriging. Displayed using QGIS.
Project Duration
1 Month
The results indicated a clear pattern on the N-NE portion of the field, with high spatial variability and maximum impedance at 10 to 20 cm of soil depth. As it was shown in a previous study (Rienzi et al, 2016), uncontrolled machinery transit is responsible for the increasing in impedance observed under NT through the years. In this case, was responsible of a 35% of yield loss (corn). The soil water storage increases after the recommended treatment, reaching the proper value in accordance to the capacity of this soils.
- Reference: E.A.Rienzi, A.E. Maggi, M Scroffa, VC Lopez, P. Cabanella 2016 Autoregressive state spatial modeling of soil bulk density and organic carbon in fields under different tillage systems. Soil & Tillage Research 159: 56–66
Project: Erosion control in a farm. Terraces and No Tillage in contour rows
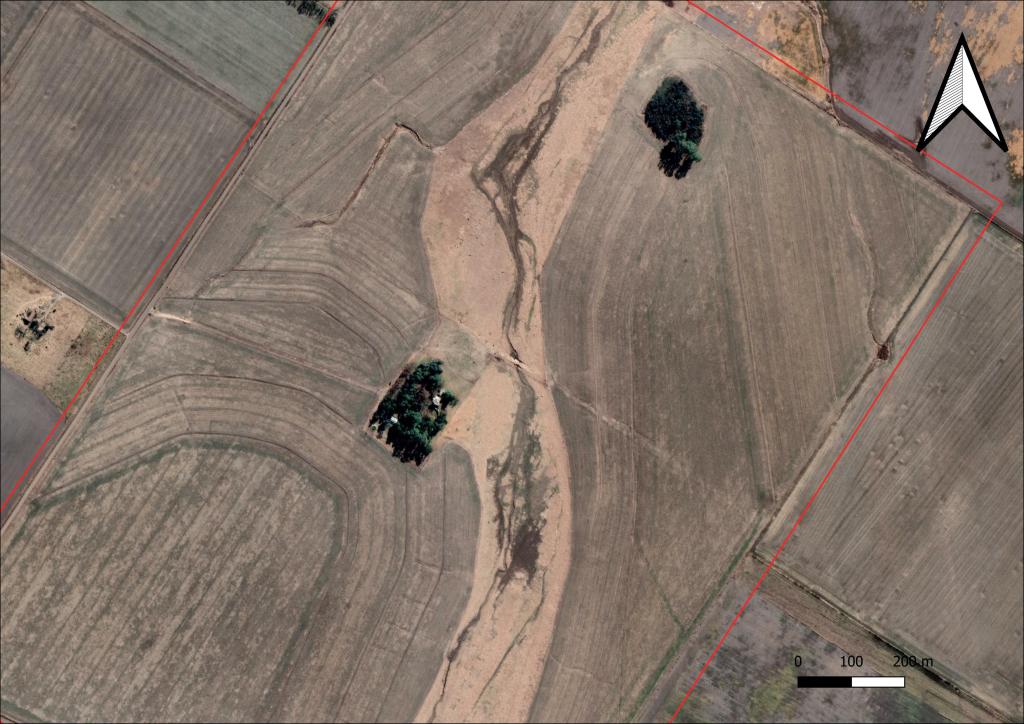
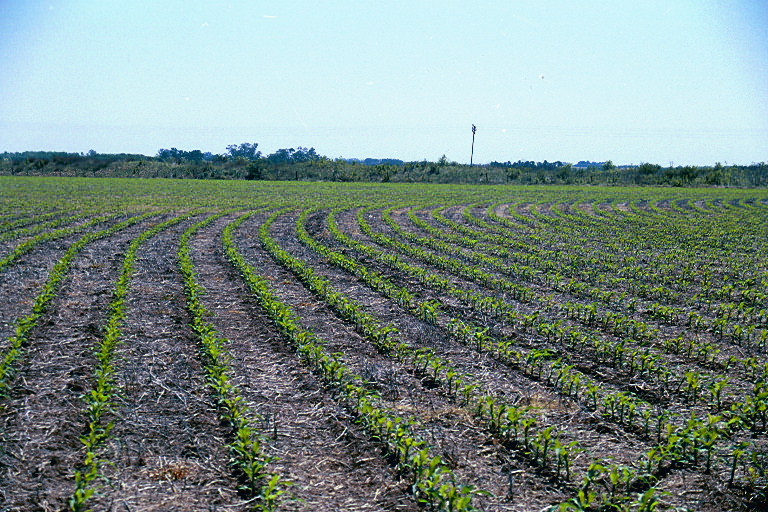
Drone capture-image of a farm with diversion terraces and contour tillage to storage water and reduce erosion risks
Technology: Hydrology calculations, 24 hs storm, 10 yrs recurrency; include design and flags located in the field for operator-ready -to- use, verifications and corrections when needed.
Project duration: for the total control system (diversion terraces with trapezoidal vegetated channels and contour tillage): 24 months.
A detail from the field of soybean under no tillage and contour lines. With proper field-placed guidance, both practice increase the yield by 25 % in the first year.
Our Services:
* Certification and verification of Carbon for VCM
With more than 15 years of experience sampling and evaluating C sequestration, we can offer a complete evaluation of C in the specific area, not only in forestry or pasture but in the entire system, including possible losses and forecasted scenarios.
* Soil degradation assessment and restoration
We offer a complete evaluation of soil properties, physical, biological and chemical at proper scale, in accordance with the activity considered. Crops yield depend on fertility as well as water content and proper physical environment to express maximum potential with minimum cost.
* Soil erosion, assessment and control
The sustainability of the best management practices implemented depend on the proper diagnostic. More than 15 years of working in the field give us an holistic point of view of the erosion control by controlling water movement. Water storage is a key for better yield.
* Risk analysis and Environmental pollution
We used a variety of tools, including EPA and USGS models with real data to evaluate TMDL or detecting and forecasting specific pollutants in rivers and streams, In addition, we offered flooding, drought or erodibility risks, evaluated and forecasted in different scenarios as expected from the Climate Change, in order to improve or reduce the insurance costs.
